A proof of concept research project, presented in story form. With pictures. By stack.io.
Let's talk about monitoring
Observability, while an old concept, has recently sprung back up into the ethos of technology jargon.
From a technology perspective, at its core, observability is simply the ability to see, or monitor, what is going on inside an application. This is not new - Systems People have always needed to monitor things.
So why is this term popping up now? To understand it, we need to go back in time to the origins of monitoring.
Dawn of (computer) time
According to two guys (Dennis Ritchie and Ken Thompson), the (Unix) universe began on January 1st, 1970 (a.k.a. Unix epoch time).

At the time, the universe was small and contained within the footprint of Bell Laboratories in Murray Hill, New Jersey, USA.

It took some time for this universe to coalesce, and for computer systems to interconnect with one another. But on August 6, 1991, trace elements of HTTP, HTML, and URLs condensed and collapsed to form the very first website.

This was the birth of the World Wide Web and the dawn of the Information Age.

Right around the era of Mosaic and Netscape in the mid 90s, at a time when the internet and computer ownership was shifting from luxury to commodity, businesses realized that money can be made from this World Wide Web, and began pouring money into it. Lots and lots of money.

Websites transitioned from being primarily information-based to focus on commerce, marketing and brand awareness. This is what eventually came to be known as the Dot-com Bubble.

Are you available?
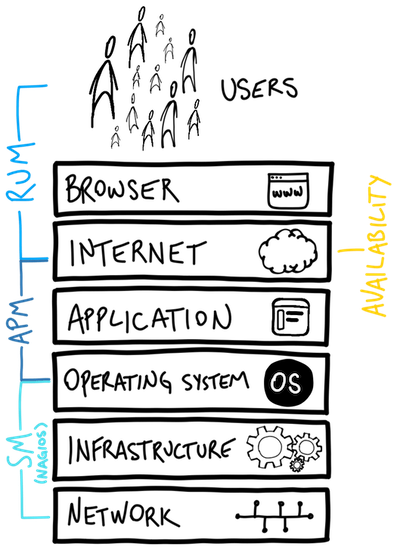
As we probably all know, all things, on a long enough timeline, will eventually fail. As more money went into the web and e-commerce, the more costly failures and outages became. This necessitated the need to monitor, and the concept of Availability came into the ethos.

At first, it was as simple as monitoring uptime - literally “is the website up and running?” Network ping and simple HTTP checks were used at fixed intervals. Unexpected responses would usually result in an email, SMS, and even pages.

Then came The Great Dot-com Crash. Hopes and dreams dashed, and darkness set upon the web.

But the need for monitoring what little was left still remained. Systems People grew tired and impatient with the unsophistication of simple pings and http checks.
“Telling me something is broken, doesn’t tell me how to fix it”
You need to be Nagged
It wasn’t enough to simply monitor availability - Systems People needed to see what was going on from the inside. The need to better monitor what was going on from the inside grew strong. Thus, Systems Monitoring (SM) entered the ethos.
The Systems People that forged ahead utilized scripts and small command-line programs to check on the internals, using outputs of commands to check on numbers. Using concepts of thresholds, these numbers were compared, and when thresholds were breached, emails were sent. Lots and lots of emails. These were the beginnings of what eventually became system monitoring tools, such as Nagios - software that runs scripts, checks results, and nags you when they breached thresholds.

Usage grew throughout the 2000s, and once again all was well on the web front. Until it wasn’t. As complexity grew, and technology moved forward, Nagios nagged too much. Nagios lagged too much. And eventually Nagios was thrown out.
The problem with Nagios was it was still too far from the source - the application and its users.

Real users need real monitoring
The pendulum swung violently in the opposite direction and around the 2010s the focus shifted to the users. And thus, Real User Monitoring (RUM) entered the ethos, and Systems People rejoiced.

Using many different metrics and techniques, monitoring focused on observing user transactions, checking page load times, following transaction paths, and measuring error rates, all from a users perspective. This gave Systems People great insight into what users were experiencing. It allowed decisions to be made on what to optimize and what to leave based on real data.

But as the popular saying goes, all good things eventually go down*. The old and familiar enemy of tech returned with more complexity and more traffic, and all was not well again.
While RUM swung the pendulum from systems to users, it still left a void in the middle - the application.
Finally we reach the application
The problem was challenging. While systems and their metrics were mostly standardized, and user behavior captured in logs, applications were unique in how they were built. However, they all operated in essentially the same way - website visits trigger function calls, and function calls trigger others, and perhaps make requests to databases, or mail systems.
It dawned on the Systems People to trace such calls inside the application, and use something as simple as a timer to see how long each call takes. And thus, Application Performance Monitoring (APM) enters the ethos around the mid-2010s - a great leap forward in monitoring.

Third party APMs sprung up and used fancy looking websites to provide analysis on transaction calls, traces, and timing events. For the first time, introspection into the path a calls makes and where time is spent was achieved.
And for a while, there was peace in the cloud.
But then the enemy returned - complexity and traffic. The ecosystem grew, and more and more APMs, RUMs, and log aggregation services spawned. The sheer number of services added to the complexity of the system.
Systems People recognized that all these systems had much in common - they would collect various metrics and data, perhaps process them (removing sensitive info, aggregating), and send off to the service for further analysis. Each has its own proprietary data format, and the data is usually stored at the 3rd party, and you may not even own the data.
Observability - an old new concept
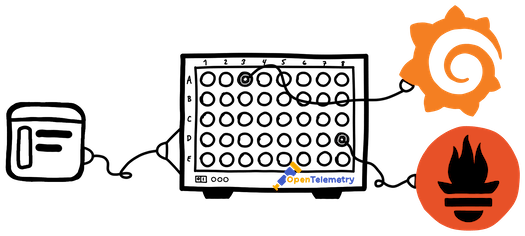
So the Systems People had a thought - What if this could all be centralized and standardized? What if this “telemetry” data was collected once, processed according to each need, and sent along for further analysis? All these tools do the same thing at the start - why not just do it once?

And in the late 2010s/early 2020s, Observability entered the ethos.

And OpenTelemetry was born.

Well, not exactly - OpenTelemetry is a result of a merger between OpenTracing and OpenCensus and serves a specific purpose - to collect, process, and export metrics (telemetry) data.

It effectively de-couples data collection from analysis and gives Systems People great power over their data.

It utilizes a single API and unified data structure, and has support for many many different types of exports.
Oh, and it’s also vendor agnostic.
And it’s part of the CNCF.
As its popularity grew, more and more 3rd party services adopted the standard data format and began accepting it as an alternative to their own collection methods. The standardized and decoupled nature of OpenTelemetry means that swapping external/3rd party tools is trivial and simply a matter of configuring the exporters.
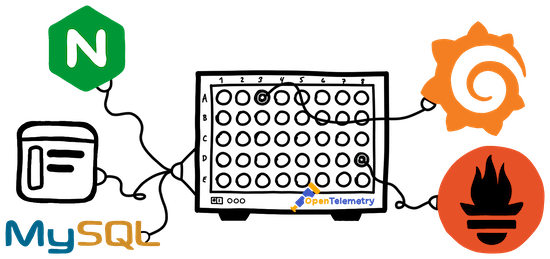
OpenTelemetry is not limited to tracing the application, but can also hook into the other layers of a typical web application stack, such as web servers (nginx), orchestrators (Kubernetes), and databases (MySQL).
Taken in the context of this history, OpenTelemetry is a natural evolutionary step in the monitoring space.
Looking to the future
Having a centralized and standardized data collection method enables opportunities beyond observability/monitoring. Machine learning and artificial intelligence (ML/AI) models have recently shifted into the mainstream. It’s still early days, however use cases for applying ML/AI techniques are cropping up everywhere and new models are being trained every day.
One thing all ML/AI models need is data. Lots and lots of data. OpenTelemetry has the ability to produce data. Lots and lots of data. I hope you can see where this is going. By hooking up an OpenTelemetry exporter to an ML/AI model, an opportunity arises where training data can be fed and processed.
A recent concept of “Adaptive Applications” has come into the ethos, whereby trained ML/AI models are able to predict behaviors and proactively make adjustments to a live environment. Scaling of a cloud environment is a perfect match for such predictive/adaptive models. Currently, scaling techniques usually involve thresholds and trigger events to start scaling up/down an environment based on load and other metrics. In other words, reactive.
An ML/AI model, trained on traffic flows/patterns may be able to predict traffic surges and proactively scale an environment up/down. In fact, such models already exist with the likes of PredictKube.
Other uses could include security monitoring, whereby deviations from standard application behavior may trigger security alerts or actions. OpenTelemetry can feed data into an ML model from say Falco, and based on established patterns, notify Systems People of unexpected events.
OpenTelemetry evolves from the foundational principles of early monitoring, marking a pivotal moment in observability's trajectory. Not merely a nod to the past, it's a bridge to the future of both monitoring and observability. As the AI and machine learning era unfolds, OpenTelemetry's data prowess becomes even more central. Take PredictKube as an example: it's an early indication of the transformative potential when observability meets predictive analytics. It's more than monitoring; with OpenTelemetry, systems are empowered for anticipatory actions and heightened security. OpenTelemetry isn't just a tool but a blueprint for a future where traditional monitoring is enriched by advanced observability, setting the stage for adaptive tech solutions.
Need assistance or a quick demo?
Do you need help implementing or have questions?
We're here to help!
Get Notified
Be the first to know when we release another POC